

There's a specific kind of frustration that comes from opening a finance app, looking at a perfectly organized breakdown of your spending by category, and still not understanding what actually happened to your money. The categories are all there — groceries, dining, transport, subscriptions — and yet the question that sent you into the app in the first place, something closer to "why does it feel like I have less than I should," remains completely unanswered.
That gap is exactly what Finu Spending Insights was built to close. Not another way to slice the same categories. A different kind of tool entirely — one built to actually answer the question, not just illustrate it.
The problem with category breakdowns
Traditional spending trackers are built around a simple assumption: if you show someone enough data, understanding will follow. Sort every transaction into a bucket, add up the buckets, display them as a chart, and the user will connect the dots themselves.
In practice, this puts all the analytical work back on the person least equipped to do it in the moment — someone who's anxious about their balance, short on time, and not particularly interested in becoming an amateur data analyst just to understand their own bank account. A pie chart showing that 22% of spending went to "food" doesn't explain whether that's normal for them, whether it's rising, or why. It just restates the transactions in a different shape.
Research on spending behavior backs this up. Financial stress tends to track less with the actual size of someone's spending and more with how unpredictable or unexplained it feels to them. A category breakdown gives structure, but not explanation — and explanation is almost always what people are actually after.
What Finu Spending Insights actually analyzes
Spending Insights goes a layer deeper than categorization. Instead of just sorting transactions, it looks at patterns across time: how your spending in a category compares to your own recent history, what changed and when, which charges are recurring versus one-off, and how spikes or dips line up with real-world triggers — a change in routine, a one-time event, a shift in income timing.
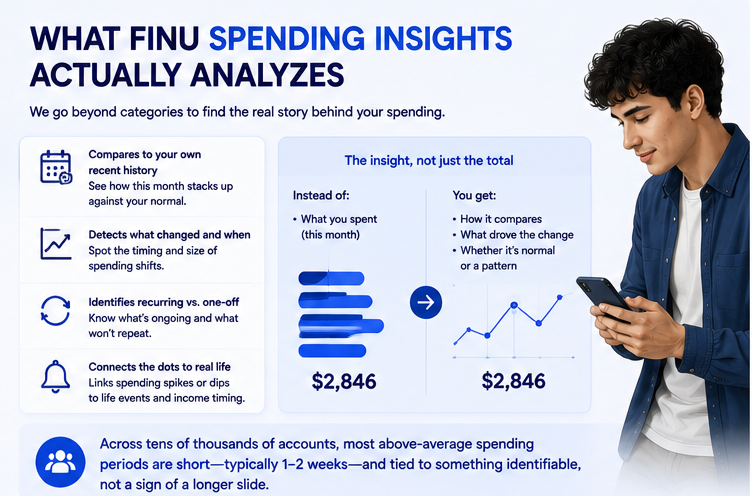
This means Finu isn't just telling you what you spent. It's telling you how this month compares to your normal, what's driving the difference, and whether it's a pattern worth paying attention to or a short-lived blip that isn't cause for concern. Aggregated, anonymized Finu account data shows why this distinction matters: across tens of thousands of accounts, most periods of above-average spending turn out to be short — typically a week or two — and tied to something identifiable, rather than a sign of a longer slide. A tool that only shows totals can't tell the difference between those two situations. A tool built to analyze patterns can.
The kinds of questions people can actually ask
The clearest way to understand what Spending Insights does differently is to look at the kinds of questions it's built to answer directly, in plain language, rather than questions a user has to answer themselves by staring at a chart:
"Why is my spending higher than usual this month?"
"Is this restaurant spending normal for me, or is it creeping up?"
"What changed between this month and last month?"
"Which of my subscriptions have I barely used?"
"Is this a one-off expense or part of a pattern?"
These aren't hypothetical examples. They're close to the actual, repeated questions Finu users bring to the app again and again — the same handful of concerns, phrased slightly differently by different people, week after week. Spending Insights was built specifically around that recurring set of real questions, rather than around a generic idea of what a "complete" financial dashboard should contain.
How this differs from simply displaying categories
The distinction here isn't cosmetic. A category display is passive — it hands over data and expects the user to do the interpretive work. Spending Insights is active — it does the interpretive work first and hands over a conclusion, with the reasoning visible underneath if someone wants to dig further.
Take a concrete, anonymized example. A Finu user we'll call Sam noticed his balance felt tighter than expected one month, despite no single big purchase standing out. A standard category view would have shown him modestly elevated numbers across dining, transport, and a couple of subscriptions — technically accurate, but not particularly illuminating on its own. Spending Insights instead surfaced the actual story: a short stretch of higher-than-usual takeout spending during an unusually demanding week at work, plus two forgotten subscriptions renewing in the same billing cycle. Once it was framed that way, the "why" behind the tight month took seconds to understand, not a category-by-category comparison exercise.
This is the core difference. A dashboard shows you the pieces. Spending Insights assembles them into an answer.
Built to explain, not just to display
One thing that's deliberate in how Spending Insights is built: it doesn't just deliver a verdict and move on. When it flags something — a spending spike, a rising category, a subscription worth reconsidering — it shows the reasoning behind the flag, in the same plain language you'd use talking to a friend who actually understood your finances. Not "spending anomaly detected," but a real explanation of what changed and why it's worth noticing.
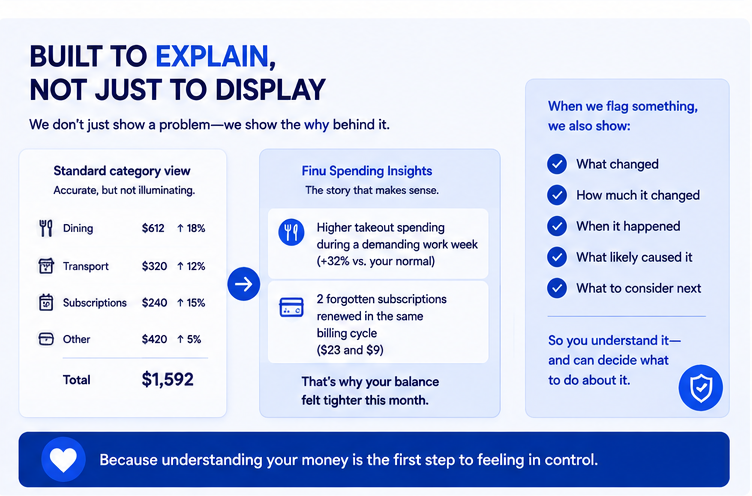
This matters because trust in this kind of feature isn't automatic. People are reasonably skeptical of tools that hand over conclusions without showing their work, especially when it comes to something as personal as their spending. Spending Insights is built around the idea that an insight is only actually useful if the person receiving it can see why it's true — not just take it on faith.
Where this fits into the bigger picture
Spending Insights isn't meant to replace the ability to look at raw transactions or a full category breakdown when you genuinely want one — that view still has its place for a deliberate monthly review. What it changes is the default. Instead of the app assuming you want the entire dataset laid out and interpreted by you, it assumes you probably have a specific question on your mind, and it tries to answer that question directly, the way a knowledgeable friend would if you asked them to look at your bank statement and just tell you what was actually going on.
That's the real shift here — not more data, not prettier charts, but the analytical work finally happening on the app's side instead of yours. Where your money went shouldn't require you to become your own financial analyst to find out. It should just be something you can ask, and get a real answer to.