

Somewhere around the time you cross tens of thousands of connected accounts, a strange thing happens to the data. Individual stories start to blur, which is exactly what should happen, and something else comes into focus instead: patterns. Not "this person spent $47 on a Tuesday," but "people, in general, behave this way when a paycheck lands, or when a bill is due, or when the weekend starts."
We looked across 54,000 anonymized, aggregated Finu accounts to understand what these patterns actually look like at scale. Nothing here is tied to an individual, a name, or a single account — every figure below is a pattern across thousands of people, not a peek into anyone's personal ledger. That distinction matters to us as much as the findings themselves. The point of aggregation isn't to know more about any one person. It's to know more about people, so we can build something that actually understands them.
Here's what showed up.
Money moves in a weekly rhythm, not a monthly one
Budgeting advice tends to assume life happens in tidy monthly blocks — rent on the 1st, budget reset, repeat. The aggregated data tells a different story. Spending doesn't really breathe on a monthly cycle. It breathes weekly, and often even more specifically, around the days people are actually paid.
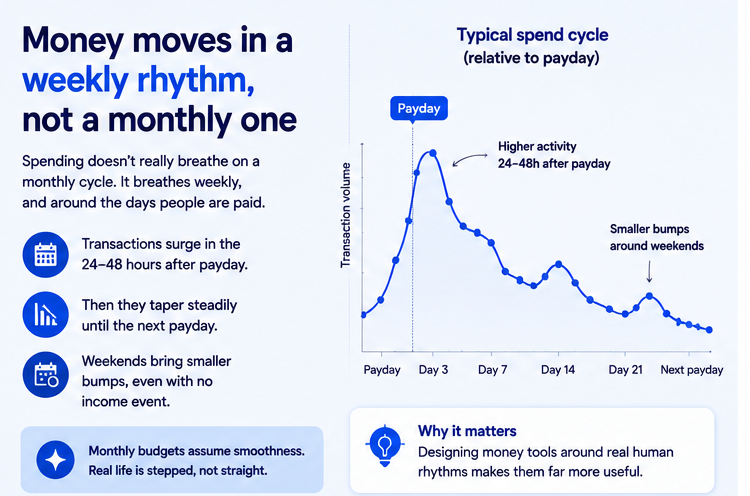
Across the dataset, transaction volume climbs sharply in the 24 to 48 hours after a typical payday, then tapers steadily until the next one. That's not surprising on its own. What's more interesting is the shape of the taper. It isn't a straight line down — it's stepped, with smaller bumps around weekends throughout the pay cycle, even in weeks with no income event at all. People don't spend evenly. They spend in bursts that cluster around the parts of the week when they have the most freedom, and the most fatigue, to make decisions.
This is one reason monthly budgets so often feel like they're fighting human behavior instead of working with it. A budget built around a calendar month assumes a smoothness that real spending simply doesn't have.
A small number of categories carry most of the emotional weight
When we grouped spending by category across the aggregated accounts, the raw numbers were fairly predictable — housing, groceries, transport, and bills make up the largest, steadiest share of outgoings for most people, month after month. Nothing shocking there.
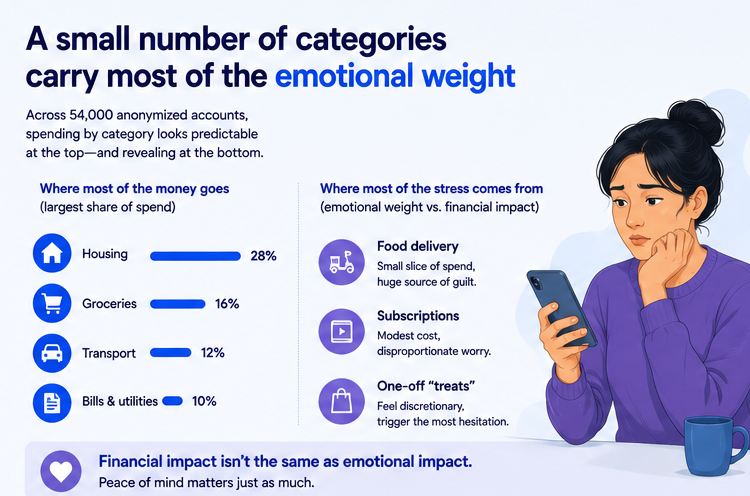
What stood out was in the smaller categories: food delivery, subscriptions, and one-off "treat" purchases account for a modest slice of total spend, typically in the high single digits as a percentage of income, but they show up disproportionately often in the moments right before someone checks their balance anxiously or reaches out for help understanding a spending spike. In other words, the categories doing the most damage to someone's peace of mind are frequently not the categories doing the most damage to their actual finances.
That gap between financial impact and emotional impact is one of the more useful things aggregated data can reveal. It suggests that a lot of financial stress isn't really about the size of the number. It's about categories that feel discretionary, a little indulgent, and therefore a little guilt-inducing, regardless of whether they're actually the thing tipping someone into difficulty.
Subscription creep is real, and it's remarkably consistent
Across the aggregated accounts, the average number of active recurring subscriptions per user sits meaningfully higher than what people tend to estimate when asked to guess their own count. This gap between perceived and actual subscription load shows up consistently enough, across enough accounts, that it looks less like a quirk of a few disorganized people and more like a structural feature of how subscription-based products are designed to be signed up for once and never actively reconsidered.
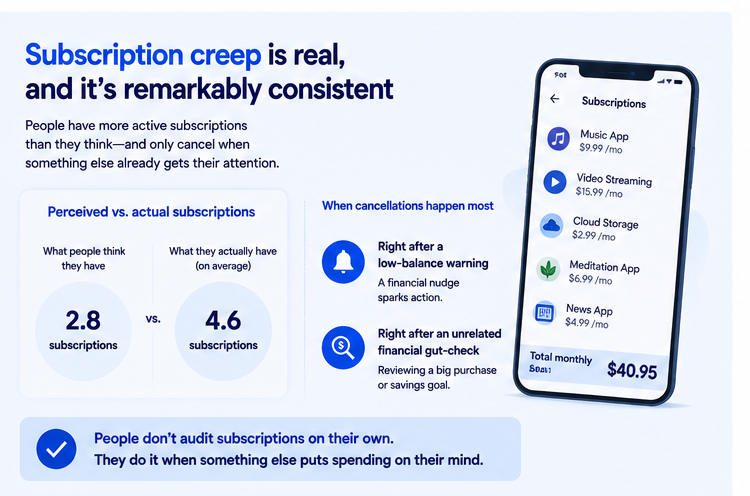
The pattern that stood out most: subscription cancellations cluster heavily around two moments — right after a low-balance warning, and right after an unrelated financial gut-check, like reviewing a big purchase or checking in on savings goals. People rarely audit subscriptions on their own initiative. They audit them when something else has already put spending on their mind. That's a useful thing to know if you're trying to build tools that actually get used, rather than tools that are technically available but sit untouched.
Overspending is often a short, specific event — not a lifestyle
One of the more reassuring patterns in the aggregated data: for most users, periods of spending meaningfully above their typical baseline are short — usually contained to a week or two — rather than sustained drift over months. Spending spikes tend to be tied to identifiable, bounded events: a holiday, a move, a big one-off purchase, a stretch of higher-than-usual bills landing close together.
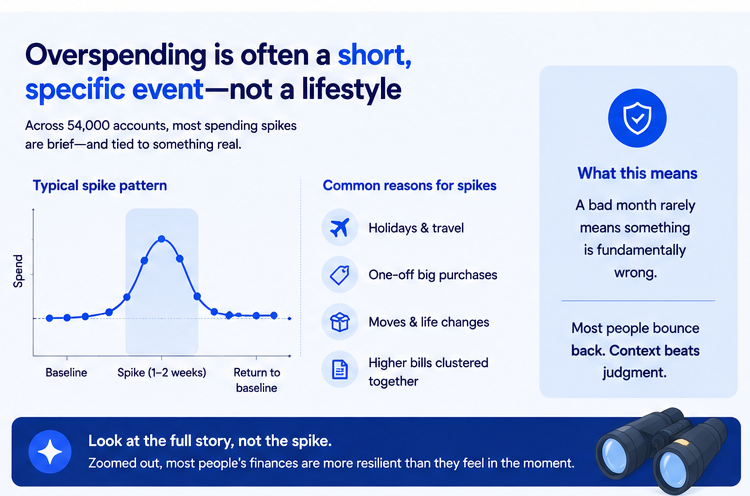
This matters because it pushes back against a narrative a lot of people carry privately, which is that a bad month means something is fundamentally wrong with their habits or their self-control. Across tens of thousands of accounts, the more common pattern is a temporary spike followed by a return to baseline, not a permanent slide. Financial stress often comes less from the spike itself and more from the fear that the spike is the new normal, when the aggregated evidence suggests it usually isn't.
Financial confidence and account-checking frequency move together
We also looked at how often people check their accounts and how that relates to broader financial behavior. Unsurprisingly, more frequent checking correlates with lower reported financial anxiety, but the more interesting finding is about direction. Checking behavior tends to increase in the days following a helpful, clarifying interaction — someone gets an explanation that makes sense of a confusing pattern, and they come back to check in again sooner than they otherwise would have.
This suggests that anxiety around money isn't just reduced by having more information available. It's reduced by having information that's been interpreted, once, in a way that made sense — and then the habit of checking in becomes less about vigilance against catastrophe and more like a normal, low-stakes part of someone's week.
Why this matters beyond the numbers
None of these patterns are especially dramatic on their own. Nobody's mind is going to be blown by the idea that people spend more after payday, or that subscriptions accumulate quietly, or that a bad week can feel like a bad month. But that's sort of the point. Aggregated across 54,000 people, these small, human, slightly irrational patterns turn out to be remarkably consistent — consistent enough to build around.
It's also a reminder of why aggregation, done carefully and anonymously, is valuable in the first place. No single account tells you much about human behavior in general. Thousands of them, stripped of anything identifying and looked at together, tell you quite a lot — not about any one person's Tuesday, but about the shared, ordinary shape of how people relate to their money. That's the layer we're most interested in, because it's the layer that lets us build something that responds to how people actually behave, rather than how a spreadsheet assumes they should.